The New Yorker on the Real Value of a College Education

The title of New Yorker writer John Cassidy’s insightful article in the September 7 issue of the magazine is College Calculus–What Is the Real Value of a College Education? The use of the word “calculus” is more than a nod to the subject many college students dread; it is also an accurate term for the subtlety and complexity facing students and parents as they try to sort out what makes the increasingly expensive college experience worthwhile.

Cassidy describes the evolution of concepts that have defined the value of a college degree.  Once upon a time a degree, in almost any subject, from almost any college, was a “signal” of achievement, the degree itself providing sufficient entree to a broad range of vocations as well as to widespread respect in society.

Then came the concept of “human capital,” a term defining the instrumental value of a degree. The more one learned in a discipline with vocational promise, the more one’s “capital” increased.

But how does either term apply now in a nation where about half of the citizens aged 25 to 34 possess some form of college credential? The “signal,” once loud and clear, has become attenuated as it has spread. And even the idea of human capital, still ascendant, is subject to the whims of a world economy in which today’s dream vocation is tomorrow’s robotic solution. Added to this is the demand by employers for the lowest cost employees, with the most recent take on what is sure to be a passing bit of expertise. We want you now, they say, knowing that once your moment has passed–or your pay has risen–you will be gone.

The signal that the degree now conveys for all too many graduates is that they are likely to be more employable than people without degrees for jobs that in fact…do not require a degree.

Are there exceptions? Yes, but they are reassuring to only a few. Graduates of the most prestigious colleges still carry a strong signal to employers and the world. Is this because the graduates are in fact better educated, more articulate–or just more efficient cognitive machines?

Citing the work of Lauren Rivera of the Kellogg School of Management at Northwestern, Cassidy writes that the “recruiters didn’t pay much attention to things like grades and majors.” Instead, as Rivera says, “It was not the content of education that elite employers valued but rather its prestige.”

So prestige alone works if a student can get into a college that rejects 80-95 percent of its applicants, with about three-fourths of those rejected applicants actually possessing the requisite ability to succeed at those institutions. And this at a time when many colleges gin up the number of applicants to they will look more selective by rejecting almost all of them.

No wonder many parents and students opt for the seemingly safer “human capital” approach. Cassidy writes that Peter Cappelli of Penn’s Wharton School is skeptical about this concept of value, too, his work showing that only about a fifth of recent STEM grads find jobs in their fields.

“The evidence for recent grads suggests clearly that there is no overall shortage of STEM jobs,” Cappelli said. (Here we should add that most engineering grads are, for the time being, much more in demand than “overall” STEM degree holders, many of whom have degrees in biological sciences.)

Faced with this situation, even students among “the talented tenth” need to plan very carefully. With no pretense of capturing the calculus of Cassidy’s informative piece, we argue that students should develop what we will call, inelegantly, “differentiators.” Unable to win the lottery of gaining admission to a super prestigious college, where the signals are a legacy to grads who may or may not be individually deserving, students can still develop a formula for developing real, lasting skills and knowledge that might make them more balanced and successful in their lives. In the end, the seeming disadvantage of not gaining the automatic cred of a degree from Harvard, Berkeley, Stanford, MIT, Virginia, or Yale could turn into an array of advantages, all of them earned.

  • Go to the best public or private college that you can afford, really afford.
  • If there is an honors college or extensive honors program, apply.
  • If you are an engineering or tech major, regard the liberal arts, sciences, and social sciences as critical elements in your development.
  • If you are a humanities or social/behavioral science major, regard math and the sciences as critical elements in your development.
  • Give serious thought to pursuing a minor that contributes to your personal growth or provides more career potential.
  • Take advantage of seminars and discussions. Learn to think about what you say, understand and accept criticism, and anticipate arguments against your own.
  • Pursue an honors option that includes a thesis or a capstone project. It’s more work, but that’s the point. They are hard evidence of persistence, depth, and sophistication. They are “signals.”

At the end of his article, Cassidy quotes Cappelli, the Wharton scholar, and the quote is worth remembering:

“To be clear, the idea is not that there will be a big financial payoff to a liberal arts degree,” Cappelli writes. “It is that there is no guarantee of a payoff from very practical, work-based degrees either, yet that is all those degrees promise. For liberal arts, the claim is different and seems more accurate, that it will enrich your life and provide lessons that extend beyond any individual job. There are centuries of experience providing support for that notion.”

Honors News is a regular (not always daily) update, in brief, of recent news from honors colleges/programs and from the world of higher ed. Occasionally, a bit of opinion enters the discussion. These brief posts are by John Willingham, unless otherwise noted.
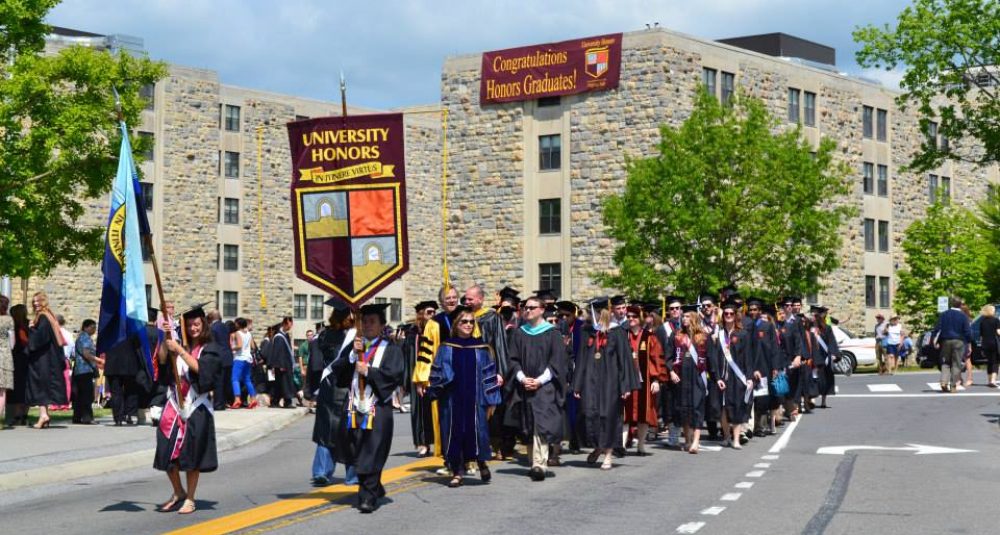
Penn State Schreyer Dean: Honors College is a Gateway and Incubator for ALL Students

Editor’s Note: The following guest article is from Christian M.M. Brady, Ph.D., Dean of Schreyer Honors College at Penn State University. The College is a recognized leader in honors education, and one of only seven to receive a five mortarboard rating in A Review of Fifty Public University Honors Programs.

“Honors programs and colleges are each as distinctive and unique as the college or university of which they are a part.” This is how I begin every presentation I make to prospective students and their parents. There is no one set definition of what an honors program is, other than that all programs have the general goal of enhancing and enriching a student’s academic experience. The mission, vision, character, nature, and experience of each program or college will vary widely even as they all achieve that single goal.

I have had the great pleasure to be the director Tulane University’s Honors Program and I am now in my tenth year as dean of the Schreyer Honors College at Penn State University. I have also been a part of and led reviews of numerous other honors programs and colleges around the country. This combination of intimate working experience and the opportunity to survey the national landscape has led me to the personal conviction that honors education should be built upon two pillars resulting in an “osmotic incubator.”

Osmotic

“Accessibility,” “permeability,” and “leaven” are all terms I have used to describe this attribute. I remained a pre-med student long enough to know that “osmosis” is the process by which molecules can pass through a membrane from one region to another. Honors education may be thought of in these terms, to a certain extent, taking in students at different stages while at the same time the college should be making contributions to the rest of the university.

In the Schreyer Honors College (SHC), as in all programs, resources are limited and therefore so is the number of students we can enroll. At Penn State we are able to enroll up to 300 first-year students as Schreyer Scholars. The total first-year enrollment at Penn State [all campuses] is nearly 20,000 students so this represents a very small percentage of the whole. It is the nature of honors programs that they are small in size so that the impact upon the students can be maximized, but that makes it all the more imperative that they be a mechanism for taking in students after their first year.

The “Gateway” entrance to the SHC was already in place at Penn State long before my arrival and it is an excellent solution to the challenge of finding the right size for an honors college. Students who have achieved a minimum GPA of a 3.7 may apply for admission into the SHC and in this manner those students who only “hit their stride” once in college can also have access to the benefits of an honors experience.

Aside from financial concerns, the primary constraint for any honors program is ensuring that our students will have the faculty support and direction they need. The Gateway selection is determined by the student’s major department; thus the department is able to ensure that they do not accept more students than they can supervise and support through their academic career, which culminates in an honors thesis.

I also believe that this egalitarian approach is in keeping with the ethos of Penn State, a land-grant institution that remains committed to the mission of providing access to education for all citizens of our commonwealth. Through the Gateway process we are able to recognize those students who have had a stellar academic career since arriving at Penn State and give them an opportunity further to excel.

This osmotic property of honors education should not be limited to enrollment. We also strive to have a positive impact in the Penn State community, moving outwards into the rest of the university. I believe that honors education should never be a “cloistered” community, set aside with few coming in and even less going out. Rather we seek to collaborate with colleges, institutes, programs, and student organizations to make a real and positive impact on our community. When we invite major speakers, such as last year when we hosted Earvin “Magic” Johnson for our Shaping the Future Summit, we set aside a dinner or reception for a smaller group of students and faculty, but the primary event is always for the entire community, both within Penn State and our geographic region.

The same is true in terms of pedagogy. Small honors courses with committed students allow for faculty to try out new and different learning and instruction techniques. We also make sure that once our honors students have enrolled in courses, any available seats in honors classes are available to all students at Penn State. They have to meet the same standards as our honors students, but they also receive the same education in the classroom. This is often how many of our Gateway Scholars begin their honors path at Penn State. Honors classes are also often the site of great innovation that benefits the entire university. This role of being a test-bed leads to my second pillar of honors education: we should be the incubator of innovation within the university.

Innovative Incubator

The concept of a tech or business “incubator” is known to most by now. These are programs, communities, or groups that provide the resources and capital necessary for entrepreneurs to move their ideas to products. We have a student organization at Penn State that strives to be just such a place for our students, Innoblue. I am their adviser, but a number of Scholars, both alumni and current students, are a part of this exciting enterprise. This concept is also how I view our role in education, “to improve educational practice and to be recognized as a leading force in honors education nationwide” (from the SHC Vision statement).

Honors education is a place where we, our students and faculty, can experiment, try different teaching methods, subjects, and curricula. This can happen because we have a great combination of engaged and creative faculty and highly motivated students. Our small size means that we can be nimble. Our faculty can try something new, knowing that our students will be able to give them instant, critical, and valuable feedback. If it works, great! We have a new course or program. If not, that is OK as well. We will have the information needed to know whether we can simply tweak it and get it right or if it really is not going to work after all. Finally, if it really works and is scalable we can take that to the rest of the university and everyone will be enriched.

This is what I believe honors education should be, an “osmotic incubator” that allows for great ideas and people to flow through enriching not only our students but our entire community. It makes for an exciting environment, full of new and nimble minds with committed and excited participants. In other words, it is why I love my job.

Scott Walker vs. The Wisconsin Idea

Editor’s Note: The following is one of our relatively rare opinion pieces.

Another presidential election year is approaching, and another presidential candidate is taking aim at the public university system in his state, and boasting of his budget cuts and alleged reforms.

This time around it’s Scott Walker of Wisconsin; in 2012 it was Rick Perry of Texas.

Opportunistic politicians and ideologues found major public universities to be an easy target for criticism and budget cuts during the great recession, and governors long opposed to the “liberalism” in higher ed embraced the opportunity to whack away at funding for research and disciplines they didn’t like.

In the aftermath of the recession, the partisan ideology driving attacks on public higher education remains strong, and in the state of Wisconsin, Scott Walker has doubled down on efforts to cut funding for the University of Wisconsin system even as other states are reinvesting in their own universities.

Rick Perry embarked on a similar crusade against the University of Texas and Texas A&M systems several years ago, only to be outwitted and ultimately defeated by staunch supporters of both systems. Like Walker, Perry sought to bring a business model to the higher education systems, and by business he meant the interests of business: sacrificing the intellectual impact of higher education to the immediate and often shortsighted “needs” of business and industry.

Productivity was the buzzword in Texas, and the biggest enemies of productivity were the disciplines that brought in little money and allegedly offered no vocational advantage to students: the humanities and social sciences.

The latest developments in Wisconsin are that the UW system now has $250 million less in the current state budget, and some safeguards protecting faculty and academic programs have been eroded. That this is happening in Wisconsin is of special concern because “The Wisconsin Idea,” enshrined in state law for more than a century, articulated a high and noble purpose for public universities.

“The legislature finds it in the public interest to provide a system of higher education…” the state statute begins, but a Walker staffer proposed deleting this opening clause and replacing it with “There is created a system of higher education…”, as if placing the public interest at the forefront of the statute somehow overlooked a more important purpose.

That more important purpose becomes clear in the next section, where the staffer wrote that the primary mission of the UW system was “to meet the state’s workforce needs,” rather than “to discover and disseminate knowledge.” The staffer then struck these final words of the section:

“Inherent in this broad mission are methods of instruction, research, extended training and public service designed to educate people and improve the human condition. Basic to every purpose of the system is the search for truth.”

In the end, the proposed changes did not take hold following media scrutiny and public opposition; but the changes in the language illustrate just how far the discovery of knowledge, improving the human condition, and the search for truth have fallen in the eyes of self-serving ideologues.

This is not to say that universities, public and private, should not offer majors that have a clear vocational focus. UW Madison certainly does so, with high ranking programs in both business and engineering. The reformers would doubtless see these as ways to improve the individual’s condition economically, and thereby worth funding. But what about the individual’s sense of values, understanding of the nation’s past, appreciation of both the threats and advances of other cultures? What about research that improves health care, legal services, and education?

UW Madison now faces the loss of about 400 employees as a result of the budget cuts. The tenure protection once guaranteed by state statute has now been watered down as part of a move to make the system operate more like a corporation, with greater freedom to define and limit programs and cut faculty positions. Guess which programs will suffer? Not business, not engineering, not the hard sciences perhaps, but those pesky humanities and social sciences with all their unsettling ideas and pointed references to the lessons and values of the past.

Yes, these disciplines can wander far afield on occasion and come up with what are, or appear to be, bizarre arguments and interpretations. But here’s the thing: you never know where the most important ideas and insights will come from, and limiting the scope of higher education to vocational pursuits is far riskier than allowing scholars in all the major disciplines to pursue their research.

Ideologues are quick to urge bright students to attend elite private universities, all of which encourage and, often, lavishly fund research in all disciplines. Can you imagine Harvard without strong departments in English, history, philosophy, sociology, and psychology? Yale? Chicago? Does anyone seriously believe these schools would retain their generally deserved credibility if they were to make it their primary mission “to meet workforce needs”? They exist to challenge bright students in all major areas of inquiry. The result: leaders not only in “the workforce” but also in every other facet of life.

It is weirdly shortsighted that the governor of Wisconsin, a state without a high-profile private university, does not want the citizens of the state to have reasonable access to the highest levels of education. Like other “reformers,” he seems to operate under the assumption that there are enough elite private schools to accommodate the smartest students, even if they have to go out of state. (And, if UW Madison is significantly reduced, they will. Surely the governor can appreciate the power of a “brand” and what happens when it is lost. )

But in fact there are not enough prominent private universities to provide places for all the brightest students, and why would a governor promote policies that tend to drive these students out of his state anyway?

Thus do political opportunism and ideology lead ultimately to the worst kind of academic outcome: a brain drain.

How Much Should Public Universities Spend on Merit Aid?

Critics claim that public universities spend far too much on merit aid at a time when the focus should be on providing more need-based assistance, but the uses of merit aid are many, as are the reasons that drive the aid decisions at individual institutions.

The main problem for leading institutions, especially, is how to balance quality, access, state interests (including revenue), and public perception. In general, the most vocal critics of merit aid believe that access should trump all the other factors.

Two recent examples of that criticism come from the New America Foundation: Colleges’ Pursuit of Prestige and Revenue Is Hurting Low-Income Students and The Out of State Student Arms Race, both by analyst Stephen Burd.

First of all, some of the arguments in these and other reports are valid. For one thing, there is no doubt that the U.S. News rankings drive many colleges to spend money on generating better metrics, especially those related to test scores, selectivity, and student/faculty ratios. Some schools have become proficient in gaming the system.

The U.S. News methodology currently gives a combined weight of 9.25% to test scores and selection ratios. The use of the latter should be scrapped, given the increased use of the Common App and marketing geared to ramping up applications just for the sake of lowering acceptance ratios. (As for test scores, there are ways that colleges can game that metric as well.) The methodology also assigns a weight of 22.5% to multiple financial metrics that also pressure colleges to raise and spend more money.

State budget cuts and rising costs for instruction, research, and administration have also led to the need for more revenue. Just how much of the additional revenue is actually necessary for improved instruction is a matter of contention. (See for example Baumol’s Cost Disease and The Bowen Effect.) The combined effects of state disinvestment and the obsession with prestige and rankings have undoubtedly led to the intense focus on increasing revenues.

Yet after granting the critics a fair measure of credit, we come back to the four main factors that affect the allocation of merit aid, discussed below. And here’s a proposed standard for balancing the factors: If merit aid is denied to highly qualified, low-income students who are residents of the state, and goes instead to out-of-state students whose qualifications are about the same or less, then the merit aid is being used excessively for revenue purposes.

Quality–As noted elsewhere on this blog, the elite colleges and universities in this country, almost all of them private, simply do not have enough slots for the top 8-10% of students, based on test scores. Most of the highly talented students who are not accepted by elite private colleges will end up at public universities. Those public universities that allocate funds to support smaller classes and undergraduate research for talented students through honors programs, along with merit aid, are not only spending money to recruit students with higher test scores in order to enhance their prestige; they are also filling a real need by providing more slots for talented students. In addition, many are trying to keep talented students in state rather than seeing them leave, never to return. All too often, critics of public university spending ignore these needs.

Access–The relationship of merit aid to greater access for lower-income students is complex. Rankings and prestige have an impact on merit aid allocations, but that impact is not always what the critics see.

Some elite public universities (UC Berkeley, Michigan) offer higher percentages of merit aid than other public universities that are excellent but not so elite (although the average amounts of merit aid from Berkeley and Michigan are not especially large.) Why? The competition for UC Berkeley and Michigan includes many private elite schools, and sometimes even modest merit aid can be the deciding factor. Private universities such as Chicago, Northwestern, and Rice also offer significant merit aid, and do so to compete with the Ivies, Stanford, etc., who are so much in demand that they don’t have to offer non-need-based aid.

The University of Virginia and the University of North Carolina also compete effectively against private elites, but they have chosen to provide very limited merit aid.

For public universities at the next level, Washington, Illinois, UT Austin, Wisconsin, the competition is often with other publics, and they more than hold their own. Partly as a result of being in high demand regardless of aid, UT Austin has one of the highest enrollments of Pell Grant students and offers little in the way of merit aid.

But when it comes to public universities with lesser reputations than those listed above, the balance between aid for quality or aid for access may tip too far toward quality, sometimes with an eye on improving rankings and revenue. New America singles out the University of Alabama and the University of South Carolina for criticism. How much of this criticism is valid?

State Interests/Revenue–The state of South Carolina now funds only 10 percent of the cost of education at the flagship university. Moreover, the number of college-age students in the state is declining. New America criticizes the University of South Carolina for awarding too much merit aid to out-of-state students, who still end up providing more revenue out of pocket than in-state students, and also help to sustain enrollment levels.

If the university allocated most or almost all of its aid to need-based students within the state, the revenue would drop dramatically and the expense per student would rise. The university would probably be unable to support its excellent honors college; for that matter, the university would eventually be unable to serve as many students period. So even if the state legislature undervalues higher education, the university and many citizens believe it is in the interest of the state to increase the number of college graduates (and their families) over the long haul, and not diminish the university in the process.

Is the percentage of non-resident freshmen (45%) too high, and the merit aid they receive too much? To answer those questions, one would need to know (1) whether many highly qualified (but low-income) in-state students are not receiving aid because the aid is going to out-of-state students with equal or lesser qualifications; and (2) how many of talented out of state students will remain in South Carolina after graduation.  To the extent that highly qualified, low-income, in-state students are losing out, then the out  of state aid should be reduced.

Public Perception–Funding honors programs and offering merit aid to talented students can certainly increase the selectivity profile of a university and eventually enhance rankings and public perception. But we would draw a distinction between the aggressive gaming of the rankings and the more justifiable funding that is related to legitimate state interests. New America suggests that the extremely generous merit aid that the University of Alabama offers to talented out-of-state students is mainly to enhance rankings. But, contrary to what New America claims, the Alabama U.S. News ranking has actually fallen 13 places since 2012.

The University of Mississippi is another flagship that offers generous merit aid. What is also true is that the state of Mississippi has the second lowest percentage of college grads in the nation, and Alabama the 7th lowest. Surely these states should find ways to sustain their flagship institutions, and merit aid, for now, is one of those ways. Who knows but that some day they might join UVA, UNC Chapel Hill, UT Austin, Wisconsin and others that can go forward without so much emphasis on merit aid.

Again, we agree with New America that many universities, including some major public institutions, do use merit aid, at least in part, for purposes of moving up in college rankings and sometimes excessively for revenue purposes. But the total picture is much more complicated, resulting in one of the most difficult issues to emerge from state disinvestment in higher education.

U.S. News National University Rankings, 2008-2015

Be sure to check out the updated post, US News National University Rankings, 2012-2019. Latest rankings. US News has changed methodology for 2019 and there are some surprises after the first 35 places or so.

As promised, we are providing a table showing the U.S. News national university rankings from 2008–2015. Listed below are the yearly rankings of 125 national universities that were included in the first tier in all the years covered. Sixty three universities are public, and 62 are private.

There is now an updated list through 2018.

As a group, the private universities have had an average increase in the rankings of two places, while the public universities have had an average decline of three places, demonstrating what we have observed in the past–public universities are, in general, not on an upward trajectory in the rankings.

One reason for the phenomenon is increased “gaming” of the rankings. Some institutions, public and private, but mostly the latter, have geared their marketing and merit aid to increase the number of applicants and lower their acceptance rates accordingly. This makes them more “selective” and helps to improve their rankings. Northeastern University, for example, has risen an astonishing 54 places in the rankings since 2008 and is now ranked higher than Washington, Penn State, UT Austin, Wisconsin, Tulane, Florida, Pepperdine, George Washington, Maryland, Pitt, and many others. It is now tied with Illinois, UC Irvine, and RPI. How likely is it that in the space of eight years Northeastern has really improved from 96th to 42nd?

The U.S. News rankings not only over-emphasize the metrics related to a university’s financial resources but also, especially in the last five years or so, reward selectivity when, in fact, the results of the selectivity are already considered. Why should Stanford be rewarded for having an acceptance rate of 5% and be rewarded for having high graduation and retention rates, both of which are largely the result of selectivity. Using test scores as a factor in predicting what grad rates should be is fine, as is rewarding or penalizing schools for exceeding or not meeting such predictions. But the high scores themselves and the low acceptance percentages merely duplicate what is more properly measured by outcomes.

We will have more to say on these issues in the future. But for now, here are the historical rankings, the average of each school across eight years, and the increase or decline of each school from 2008 to the present. The universities are listed in order of their average ranking across the years.

Here is the list.

2008 2009 2010 2011 2012 2013 2014 2015 Avg Rank Chg 08 vs 15
Princeton 1 2 1 2 1 1 1 1 1.25 0
Harvard 2 1 1 1 1 1 2 2 1.375 0
Yale 3 3 3 3 3 3 3 3 3 0
Stanford 4 4 4 5 5 6 5 4 4.625 0
Columbia 9 8 8 4 4 4 4 4 5.625 5
MIT 7 4 4 7 5 6 7 7 5.875 0
Penn 5 6 4 5 5 8 7 8 6 -3
Chicago 9 8 8 9 5 4 5 4 6.5 5
Caltech 5 6 4 7 5 10 10 10 7.125 -5
Duke 8 8 10 9 10 8 7 8 8.5 0
Dartmouth 11 11 11 9 11 10 10 11 10.5 0
Northwestern 14 12 12 12 12 12 12 13 12.375 1
Washington Univ 12 12 12 13 14 14 14 14 13.125 -2
Johns Hopkins 14 15 14 13 13 13 12 12 13.25 2
Cornell 12 14 15 15 15 15 16 15 14.625 -3
Brown 14 16 16 15 15 15 14 16 15.125 -2
Vanderbilt 19 18 17 17 17 17 17 16 17.25 3
Rice 17 17 17 17 17 17 18 19 17.375 -2
Notre Dame 19 18 20 19 19 17 18 16 18.25 3
Emory 17 18 17 20 20 20 20 21 19.125 -4
UC Berkeley 21 21 21 22 21 21 20 20 20.875 1
Georgetown 23 23 23 21 22 21 20 21 21.75 2
Carnegie Mellon 22 22 22 23 23 23 23 25 22.875 -3
Virginia 23 23 24 25 25 24 23 23 23.75 0
UCLA 25 25 24 25 25 24 23 23 24.25 2
USC 27 27 26 23 23 24 23 25 24.75 2
Wake Forest 30 28 28 25 25 27 23 27 26.625 3
Michigan 25 26 27 29 28 29 28 29 27.625 -4
Tufts 28 28 28 28 29 28 28 27 28 1
North Carolina 28 30 28 30 29 30 30 30 29.375 -2
Boston College 35 34 34 31 31 31 31 31 32.25 4
Brandeis 31 31 31 34 31 33 32 35 32.25 -4
William & Mary 33 32 33 31 33 33 32 33 32.5 0
NYU 34 33 32 33 33 32 32 32 32.625 2
Rochester 35 35 35 37 35 33 32 33 34.375 2
Georgia Tech 35 35 35 35 36 36 36 36 35.5 -1
UC San Diego 38 35 35 35 37 38 39 37 36.75 1
Lehigh 31 35 35 37 38 38 41 40 36.875 -9
Case Western 41 41 41 41 38 37 37 38 39.25 3
UC Davis 42 44 42 39 38 38 39 38 40 4
UW Madison 38 35 39 45 42 41 41 47 41 -9
UC Santa Barbara 44 44 42 39 42 41 41 40 41.625 4
Illinois 38 40 39 47 45 46 41 42 42.25 -4
RPI 44 41 42 41 50 41 41 42 42.75 2
Washington 42 41 42 41 42 46 52 48 44.25 -6
UC Irvine 44 44 46 41 45 44 49 42 44.375 2
Penn State 48 47 47 47 45 46 37 48 45.625 0
U of Miami 52 51 50 47 38 44 47 48 47.125 4
UT Austin 44 47 47 45 45 46 52 53 47.375 -9
Yeshiva 52 50 52 50 45 46 47 48 48.75 4
Florida 49 49 47 53 58 54 49 48 50.875 1
Tulane 50 51 50 51 50 51 52 54 51.125 -4
Boston Univ 57 60 56 56 53 51 41 42 52 15
George Washington 54 53 53 51 50 51 52 54 52.25 0
Ohio St 57 56 53 56 55 56 52 54 54.875 3
Pepperdine 54 56 58 53 55 54 57 54 55.125 0
Maryland 54 53 53 56 55 58 62 62 56.625 -8
Syracuse 50 53 58 55 62 58 62 58 57 -8
Fordham 67 61 61 56 53 58 57 58 58.875 9
Pitt 59 58 56 64 58 58 62 62 59.625 -3
Georgia 59 58 58 56 62 63 60 62 59.75 -3
SMU 67 66 68 56 62 58 60 58 61.875 9
Connecticut 64 66 66 69 58 63 57 58 62.625 6
Purdue 64 66 61 56 62 65 68 62 63 2
Texas A&M 62 64 61 63 58 65 69 68 63.75 -6
Clemson 67 61 61 64 68 68 62 62 64.125 5
WPI 62 71 68 64 62 65 62 68 65.25 -6
Rutgers 59 64 66 64 68 68 69 70 66 -11
Minnesota 71 61 61 64 68 68 69 71 66.625 0
Northeastern 96 96 80 69 62 56 49 42 68.75 54
Iowa 64 66 71 72 71 72 73 71 70 -7
Virginia Tech 71 71 71 69 71 72 69 71 70.625 0
Delaware 71 71 68 75 75 75 75 76 73.25 -5
Michigan St 71 71 71 79 71 72 73 85 74.125 -14
Brigham Young 79 113 71 75 71 68 62 62 75.125 17
Indiana 75 71 71 75 75 83 75 76 75.125 -1
Baylor 75 76 80 79 75 77 75 71 76 4
Miami Oh 67 66 77 79 90 89 75 76 77.375 -9
Marquette 82 77 84 75 82 83 75 76 79.25 6
Colorado School of Mines 75 80 77 72 75 77 91 88 79.375 -13
American 85 83 84 79 82 77 75 71 79.5 14
UC Santa Cruz 79 96 71 72 75 77 86 85 80.125 -6
Stevens Inst Tech 75 83 84 86 88 75 82 76 81.125 -1
Clark 91 80 88 86 94 83 75 76 84.125 15
Alabama 91 83 96 79 75 77 86 88 84.375 3
Colorado 79 77 77 86 94 97 86 88 85.5 -9
Binghamton 82 77 80 86 88 89 97 88 85.875 -6
Tulsa 91 83 88 93 75 83 86 88 85.875 3
Denver 85 89 84 86 82 83 91 88 86 -3
Vermont 96 89 88 94 82 92 82 85 88.5 11
St. Louis 82 80 84 86 88 92 101 99 89 -17
Auburn 96 96 88 85 82 89 91 103 91.25 -7
Drexel 108 89 88 86 88 83 97 95 91.75 13
Iowa St 85 89 88 94 94 101 101 106 94.75 -21
Stony Brook 96 96 96 99 111 92 82 88 95 8
Massachusetts Amherst 96 102 106 99 94 97 91 76 95.125 20
Missouri 91 96 102 94 90 97 97 99 95.75 -8
NC State 85 83 88 111 101 106 101 95 96.25 -10
TCU 108 113 110 99 97 92 82 76 97.125 32
Nebraska 91 89 96 104 101 101 101 99 97.75 -8
Kansas 85 89 96 104 101 106 101 106 98.5 -21
San Diego 107 102 110 94 97 92 91 95 98.5 12
UC Riverside 96 89 96 94 97 101 112 113 99.75 -17
Florida St 112 102 102 104 101 97 91 95 100.5 17
Tennessee 96 108 106 104 101 101 101 106 102.875 -10
New Hampshire 108 113 110 104 101 106 97 99 104.75 9
Oklahoma 108 108 102 111 101 101 101 106 104.75 2
Pacific 96 102 115 99 101 106 112 116 105.875 -20
Dayton 112 108 110 99 101 115 112 103 107.5 9
Illinois Tech 96 102 106 111 111 113 109 116 108 -20
Oregon 112 108 115 111 101 115 109 106 109.625 6
South Carolina 112 108 110 111 111 115 112 113 111.5 -1
Loyola Chicago 112 116 119 117 119 106 101 106 112 6
Arizona 96 96 102 120 124 120 119 121 112.25 -25
Univ at Buffalo 118 121 121 120 111 106 109 103 113.625 15
Howard 96 102 96 104 111 120 142 145 114.5 -49
Catholic 112 116 121 120 119 120 121 116 118.125 -4
Michigan Tech 124 121 121 117 111 120 117 116 118.375 8
Washington St 118 116 106 111 115 125 128 138 119.625 -20
Clarkson 124 121 119 124 119 115 121 121 120.5 3
Ohio Univ 112 116 115 124 124 131 135 129 123.25 -17
Kentucky 118 116 128 129 124 125 119 129 123.5 -11
Colorado St 124 125 128 124 128 134 121 121 125.625 3
Arkansas 124 125 128 132 132 134 128 135 129.75 -11
Arizona St 124 121 121 143 132 139 142 129 131.375 -5

The Top 10 Percent Rule in Texas: Highly Questionable Results

Editor’s Note: The following is excerpted from the most recent issue of The Alcalde, the alumni publication of the University of Texas at Austin. The automatic admission of a student in the top 10 percent of  his or her high school class, in place since 1997, has had unintended consequences for minority students and non-minority students alike.

By 2008, more than 80 percent of incoming freshman at UT-Austin were admitted under the [10 percent] rule, leaving the university to choose less than 20 percent of its own incoming class. Then-chancellor Francisco Cigarroa and UT-Austin president Bill Powers appealed to the 2009 Texas Legislature to cap automatic admissions at 50 percent of each incoming class. Without action, they predicted, UT wouldn’t be able to admit any students from outside the U.S. or Texas by 2015.

Legislators intervened specifically for UT-Austin, but compromised on a 75 percent cap. Since then, the university has admitted the top one percent, two percent, and so on until it reached the cap, which means that for the incoming class of 2019, UT-Austin’s top 10 Percent Law is really a top eight percent rule.

As ProPublica notes, the competition for non-automatic admission to UT in 2008 was tougher than getting into Harvard.

While applications from minority students more than doubled in the first 10 years of the law, its success is still debatable. A 2012 Princeton study of UT and Texas A&M concluded that the law actually benefited white students more than Hispanic students. While test scores rose at smaller state universities, applicants at the flagships came from more affluent, less diverse high schools and graduates from poorer schools, particularly Hispanic graduates, were less likely to apply.

In a state-required report compiled in the fall of 2014, UT officials noted that between 2013-14, African-American and Hispanic representation actually decreased, as did the number of admitted and enrolled first-generation students and those from lower socioeconomic groups.

One of the barriers to coming to UT, presumably, is cost. If, for example, you come from San Perlita, at Texas’ southern tip, where more than half of residents under 18 live below the poverty line, heading more than 300 miles north just to pay tuition, rent, and buy books for at least four years is a daunting prospect. In response to the declining numbers from populations meant to be served by the law, UT has launched the Texas Advance scholarship program, which the university says could essentially offset tuition when paired with state and federal aid.

While a handful of bills relating to the rule have been filed during the 2015 legislative session, only one would fundamentally change it, even then only altering it to automatically admit students from the top eight percent. That rule wouldn’t change much at UT, which is already essentially a top eight percent institution. Despite questions of its effect and effectiveness, it seems the law will stick around, at least for a while.


Once Again, The New Republic Weighs in on the Ivies, and Here’s our Response

Once again, The New Republic  is featuring an article that discusses the pros and cons of an Ivy League education.  This time, the article comes in the form of a review of New York Times columnist Frank Bruni’s new book, Where You Go Is Not Who You’ll Be.

In the TNR review, called “It Doesn’t Matter if Your Kid Doesn’t Get into Harvard,” author Nick Romeo claims that Bruni is too focused on the ability of college grads from non-Ivy institutions to achieve material success on a par with Ivy grads.

“He’s not asking his readers to examine a cultural obsession with success, so much as assuring them that they can still impress others without attending highly selective undergraduate institutions,” Romeo writes. “Just look at all the people who run huge companies or work at prestigious consulting or law firms, he says. Not all of them went to Ivy League schools! There are ‘myriad routes to a corner office,’ as he puts it. He never seriously considers the possibility that college might shape students into adults who are not interested in a corner office.”

Romeo prefers the earlier challenge to Ivy education published in TNR: William Deresiewicz’s now famous article “Don’t Send Your Kid to the Ivy League,” which appeared on July 21, 2014, and has now been “shared” more than 200,000 times.  Deresiewwicz’s article argues that many less elite schools, such as public flagships, allow bright students more latitude to discover themselves in the midst of fellow students who are not all driven or overly-focused on channeling their lives toward one thing: an Ivy admission.

The fact is that college at its best is not an either/or proposition that pits learning for its own sake against training for a career.  In almost every college in the nation there are at least three broad types of students–those who are in alive with self-discovery and intellectual excitement, those who want to get out in a hurry and find a high-paying job, and many others who are open to intellectual expansion but are acutely aware that the “real world” awaits.

The subtitle of Bruni’s  book is “An Antidote to the College Admissions Mania.”  But Nick Romeo argues that what Bruni describes “is not a bracing cure; it’s a soothing balm for upper-middle class parents whose children do not quite manage to scale the highest peaks of prestige.”

We see Bruni’s book as less an antidote than a balancing argument to the one proposed by Deresiewicz.  While many smart “kids” do and should value intellectual stimulation, they and their parents need to be practical as well.  If Bruni over-emphasizes the “antidote” of achieving career success equivalent to that of Ivy grads without attending an Ivy school, his message is one that parents and prospective students need to hear.

As we have noted many times, there are far more bright students than there are places at Ivy institutions, and these bright students should be able to find, and should know that they can find, both intellectual and career equivalence at colleges outside the Ivy League, including public honors colleges and programs.

It is well known that admission to any highly selective college can be capricious, subjective, and even approach the formulaic.  Ivy colleges are wonderful, in most cases, for students who are both brilliant and fortunate.   Students who are “merely” brilliant at one brief point of their lives need to know that the rest of their lives can be as fulfilling in all ways as the lives of their more fortunate counterparts.


Note to Parents: Changes in Major, Uncertainty about Careers Are Common

In this age of anxiety about finding a good job after college, many parents are understandably concerned if their sons and daughters haven’t settled on a major in their first year of study, or if they have changed their major from a lucrative field such as engineering to, say, a social science field.

The Higher Education Research Institute (HERI) at UCLA is renowned for its insightful reports on the characteristics and attitudes of college students, especially during the freshman and senior years.  The latest HERI survey report on Your First College Year has revealing data about the career focus (or lack thereof) and the frequency with which majors are changed during the extremely important first year.  The survey is based on responses of more than 10,000 students at 47 colleges and universities.

Here’s a quick summary:

  • 90% of first-year students found that college had “frequently” or “occasionally” inspired them to think in new ways;
  • partly as a result, 34% changed their majors;
  • 32% changed their career choices;
  • 59% thought it was important to be focused on their career path after college;
  • but only 25% had a clear idea of how to achieve career goals.

Even though many first-year students were not clear about majors and careers, their ability to sort all of this out, along with other problems they will encounter, grew dramatically during that critical year:

  • 31% of students reported at the beginning of the year that they were only “average” at critical thinking skills, but of these, 43% reported their skills as “somewhat of a strength” at year’s end;
  • and of the 27% of students who felt at the beginning of the year that they were only average in problem-solving skills, 43% thought their problem-solving skills were somewhat of a strength at the end of the year.

So parents, if your son or daughter doesn’t have it all figured out after that first year, take heart.  The very complexity that they are dealing with is teaching them at the same time how to figure things out, including their eventual majors and career paths.

Gallup and Purdue Study: Well-being for Grads Requires More than Income

What is most important about the “college experience”?  Good grades, of course.  But a recent report finds that the most important elements can be more difficult to measure.

Most parents and prospective students place an understandable emphasis on the employment and graduate school placement prospects for the graduates of a particular institution, but The Gallup Purdue Index of Well-Being makes a powerful argument that the long-term well-being for college grads is largely the result of the degree of engagement they have in the workplace, and not just the amount of money they earn.

Given the high cost of college, the Report assumes that the benefits of graduation should go beyond high starting pay and include the enjoyment of a well-lived life.  Gallup and Purdue do not discount the value of financial rewards but place them in a broader qualitative context.

The Report measures and describes the college experiences that lead to more fulfilling workplace engagement and a greater sense of well-being in the following areas:

  • Purpose–enjoying work and being motivated to do your best.
  • Social Well-Being–having love and support in your life.
  • Financial Well-Being–having sufficient financial resources to reduce stress and enhance security.
  • Community Well-Being–working within the local community, enjoying where you live, pride in the community.
  • Physical Well-Being–feeling well enough to do good work and enjoy life.

So what are the college experiences that promote engagement in the workplace and a sense of well-being in the above areas?

Students who believed that their college was a great fit for them (regardless of size and selectivity), who had professors who showed interest and made their subjects exciting, and who believed that their school prepared them well for life after college had the greatest degree of workplace engagement.

The Report demonstrates that the type of college makes little difference in workplace engagement and overall well-being, except that for-profit colleges do not promote a high degree of well-being and engagement.  The differences between public and private not-for-profit colleges, and between highly selective and less selective colleges, were minimal.  The most important elements were what students were doing in college and how they were experiencing their activities, rather than the elite or non-elite status of the school.  This finding seems to enforce what most college admissions counselors say: the most important thing for the student is finding the best fit.

More specifically, college experiences that promote engagement and prepare students for life after college are these:

  • Professors and mentors who provide inspiration, excitement, encouragement, and commitment.
  • Internships, preferably paid at some point, that directly connect university learning with the outside world.
  • Extracurricular activities, including social and special interest clubs, that directly connect learning with social engagement.
  • Long-term projects of a semester or more, including theses and capstone projects, which associate education with “deep learning” and not merely with rushed preparation for exams.
  • On-campus residence.
  • Minimal student loan debt, which is directly related to financial well-being.

The Report suggests that parents and prospective students should make direct inquiries about the best professors in the student’s proposed field of study and their availability; undergrad research programs and the means of gaining mentors; the availability of internships, including some that are paid; the presence of clubs or social groups that align with the student’s interests; and the opportunities for “deep learning” and the ways students can be aware of them and seize the opportunities.

One further implication of the Report is that a dramatic increase in online instruction would seriously diminish the advantages and a residential college experience can have for future workplace engagement and well-being.

In conclusion, we will note that many public honors colleges and programs make all of these elements more accessible, or even a part of their completion requirements.  Many require an honors thesis; they all provide opportunities for social engagement with serious students; most have connections to undergrad researchers and mentors; and most connect their students with small classes and top professors.  In addition, most have special honors residence halls and enhanced opportunities for financial aid, including non-need-based merit aid.


The Academic Reputation Ranking in U.S. News: What It Means for Honors Students

Editor’s Note: This post was updated on August 15, 2017, to include new honors class size averages based on our most recent data.

In a previous post, Based on Academic Reputation Alone, Publics Would Be Higher in U.S. News Rankings, we write that many public universities have a reputation in the academic community that is much higher than their overall ranking by U.S. News.  In this post, we will summarize the reasons that prospective honors students and their parents might consider paying more attention to academic reputation than to other factors in the oft-cited rankings.

(Another related post: Alternative U.S. News Rankings: Lots of Surprises.)

First, these are factors to consider if the state university’s academic reputation is much stronger than its overall ranking:

1.  The overall rankings penalize public universities for their typically larger class sizes, but the average honors class size in the 50 major honors programs we track is 26.3 students, much smaller than the average class size for the universities as a whole.  Most of these honors classes are lower-division, where the preponderance of large classes is often the norm. First-year honors seminars and classes for honors-only students average 19 students per section.  Result:  the relatively poor rating the whole university might receive for class size is offset for honors students.

2.  The overall rankings hit some public universities hard for having relatively low retention and graduation percentages, but freshmen retention rates in honors programs are in the 90% range and higher; meanwhile six-year grad rates for honors entrants average 89%–much higher than the average rates for the universities as a whole.  Result: the lower rates for the universities as a whole are offset for honors students.

3.  All public universities suffer in the overall rankings because U.S. News assigns ranking points for both the wealth of the university as a whole and for the impact that wealth has on professors’ salaries, smaller class sizes, etc.  This is a double whammy in its consideration of inputs and outputs separately; only the outputs should be rated.  Result: the outputs for class size (see above) are offset for honors students, and the wealth of the university as an input should not be considered in the first place.

4.  For highly-qualified students interested in graduate or professional school, academic reputation and the ability to work with outstanding research faculty are big advantages. Honors students have enhanced opportunities to work with outstanding faculty members even in large research universities, many of which are likely to have strong departmental rankings in the student’s subject area.  Result: honors students are not penalized for the research focus of public research universities; instead, they benefit from it.

5.  Many wealthy private elites are generous in funding all, or most, need-based aid, but increasingly offer little or no merit aid.  This means that families might receive all the need-based aid they “deserve” according to a federal or institutional calculation and still face annual college costs of $16,000 to $50,000.  On the other hand, national scholars and other highly-qualified students can still receive significant merit aid at most public universities.  Result: if a public university has an academic reputation equal to that of a wealthy private elite, an honors student could be better off financially and not suffer academically in a public honors program.

But…what if the academic reputation of the public university is lower than that of a private school under consideration?   In this case, the public honors option should offer the following offsets:

1. The net cost advantage of the public university, including merit aid, probably needs to be significant.

2.  It is extremely important to evaluate the specific components of the honors program to determine if it provides a major “value-added” advantage–is it, relatively, better than the university as a whole.  Typically, the answer will be yes.  To determine how much better, look at the academic disciplines covered by the honors program, the actual class sizes, retention and graduation rates, research opportunities, and even honors housing and perks, such as priority registration.